046 — Near-strict 1-spike-per-cycle ceiling: 99.45% of (cell, cycle) pairs
Abstract
nb041’s slope was interpreted as “each E cell joins a cycle with ≈ 20% probability”. That reading assumes the per-cycle spike count is bounded by 1 — an E cell either participates in this cycle or not. This notebook measures that directly: walking through every gamma cycle on the test set and counting how many spikes each E cell actually emits, on all 18 trained checkpoints in nb041’s sweep.
Result: across 48 million (cell, cycle) pairs, 99.45% have ≤ 1 spike — the architecture imposes a near-strict 1-spike-per-cycle bound, with rare violations at the 0.5% level.
Methods
For each of nb041’s 18 trained cells (6 × 3 seeds):
- Run inference on the MNIST test set; capture per-trial and spike tensors.
- Detect I-burst times per trial: smooth the population I rate with a 1-ms Gaussian, run scipy peak detection with min-distance set to half the cell’s own .
- Cycle boundaries are the midpoints between consecutive I-burst peaks (first cycle starts at , last ends at trial end).
- For each (cell, cycle, trial), count the number of E spikes within the cycle window.
- Bucket counts globally into and aggregate by .
The cycle anchor is the I-burst — this is the right anchor because the cycle is operationally defined as “the time between one inhibitory blanket and the next”, not as the time between E bursts (which can be silent on a given cycle).
Results
Spike count distribution per E cell per gamma cycle
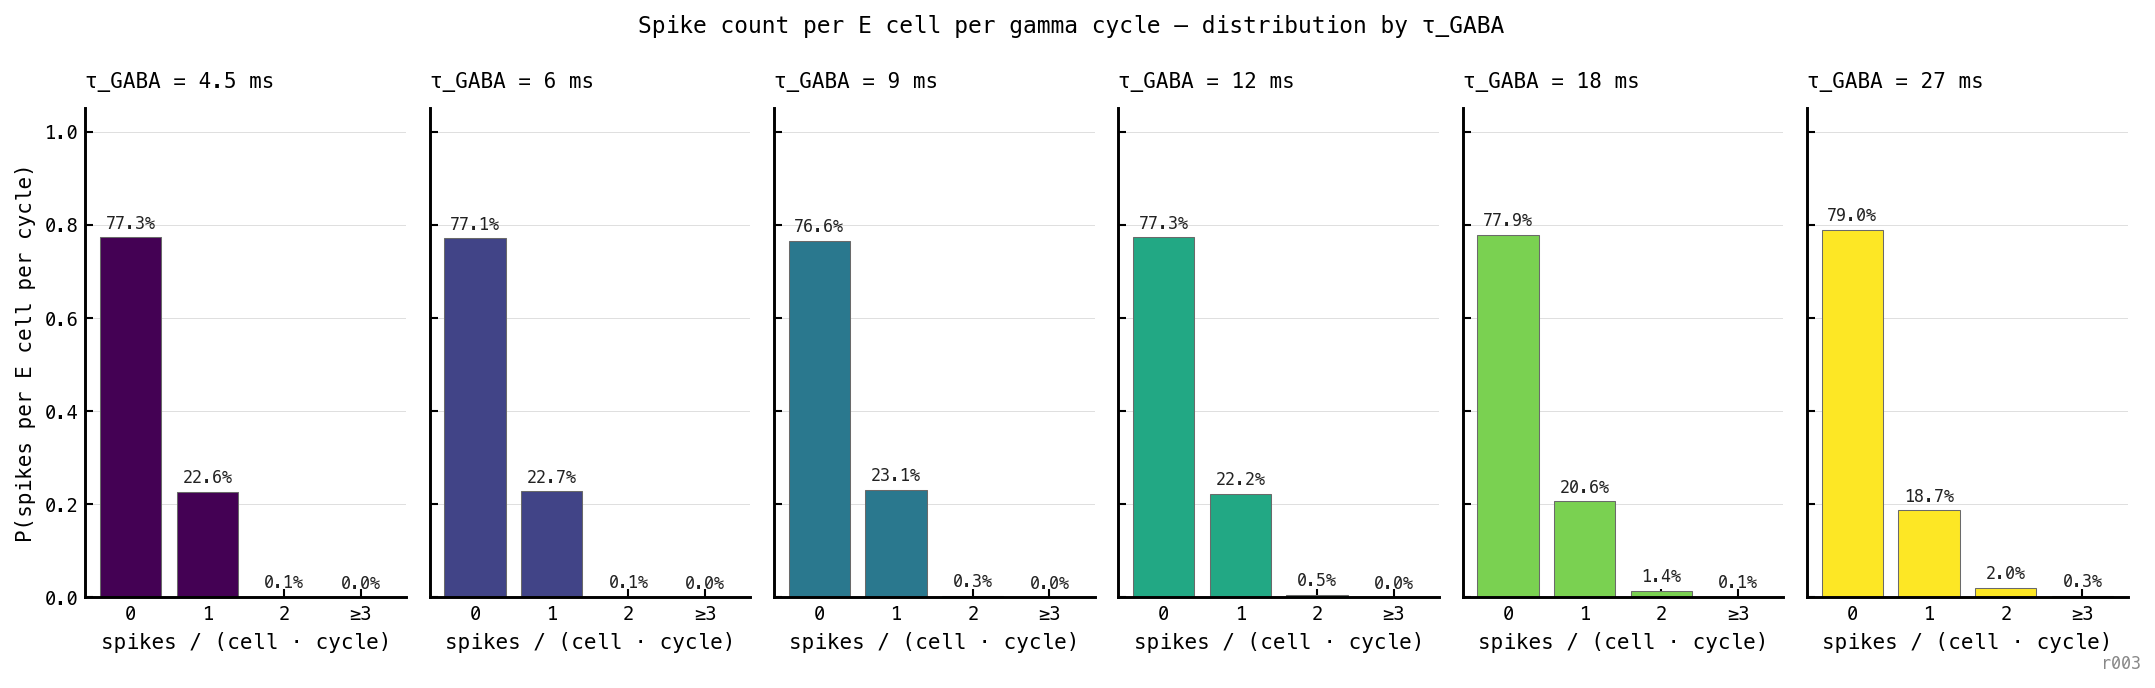
Distribution of E spike count per gamma cycle per cell, by , three seeds aggregated. Across 48 million (cell, cycle) pairs, the architecture is overwhelmingly bimodal: each cell either emits zero spikes in a given cycle (≈ 77% of the time) or exactly one (≈ 22% of the time). Two-or-more events occur in 0.55% of cycles; three-or-more in 0.04%.
The architectural cap is empirical, not just structural. There is nothing in the LIF equations that strictly forbids a second spike — refractory exhausts in 3 ms while the gamma window between bursts is 18–70 ms, so in principle multiple spikes could fit. But the loop’s geometry constrains the actual usable window: the I burst rises sharply, clamps E firmly for most of the cycle, and only the last few ms before the next I-burst onset are de-clamped. Combined with the refractory, this leaves room for one spike per cell per cycle in the typical case.
The mild rise in with — from 0.10% at ms to 2.4% at ms — is consistent with longer cycle periods allowing some marginal cells to recover from refractory and re-spike before the next I-burst. The ceiling is almost hard but not strictly enforced.
Discussion
The ”≤ 1 spike per E cell per cycle” reading of nb041’s affine law is empirically supported. Three observations:
-
The participation gate is Bernoulli, not Poisson. A Poisson process with mean spikes per cycle (matching the observed ) would predict and — roughly 5× the observed multi-spike fractions. The empirical distribution is narrower than Poisson, consistent with a hard architectural cap and only rare violations.
-
The slope is per-cycle participation. The median cell sits on the line; the affine fit’s is exactly the population-averaged Bernoulli participation probability. This grounds the slope mechanistically in single-cell behaviour rather than as a phenomenological fit parameter.
-
Cap softens at long . At ms (cycle period ≈ 70 ms), reaches 2.4% — the longer cycle gives refractory cells time to recover and contribute a second spike. The architecture’s cap is geometrically determined; very long cycles erode it.
The structural reading of nb041’s law that ar010 cites — “each E cell joins each cycle with probability , contributing exactly one spike when it joins” — is now verified at the spike-resolved level.
Cortical implication
If cortical pyramidal cells participate in gamma at a similar bounded rate, the prediction is sharp: per-pyramidal spike count per gamma cycle should be ≤ 1 in the overwhelming majority of cycles, with the population-mean participation probability – predicting both the pyramidal rate and the per-cycle gating. Awake-cortex recordings with spike-resolved pyramidal data and concurrent gamma-band LFP should be able to test this directly.
Next steps
If pursued: spike-count per cell per cycle as a function of cell input strength would let us decompose “participation” into a hit-or-miss gate (Bernoulli) at high drive vs a stochastic-fail (skip) gate at low drive. But the architectural story — “each E cell at most one spike per cycle” — is already closed.